I spent 28 years building low-latency trading systems at major financial institutions before I started working on AI systems in 2018. When I began serving large language models, I expected the performance work to feel foreign. It did not. The units changed, from microseconds to milliseconds and seconds, and the hardware changed. The way systems fail to be fast did not change at all.
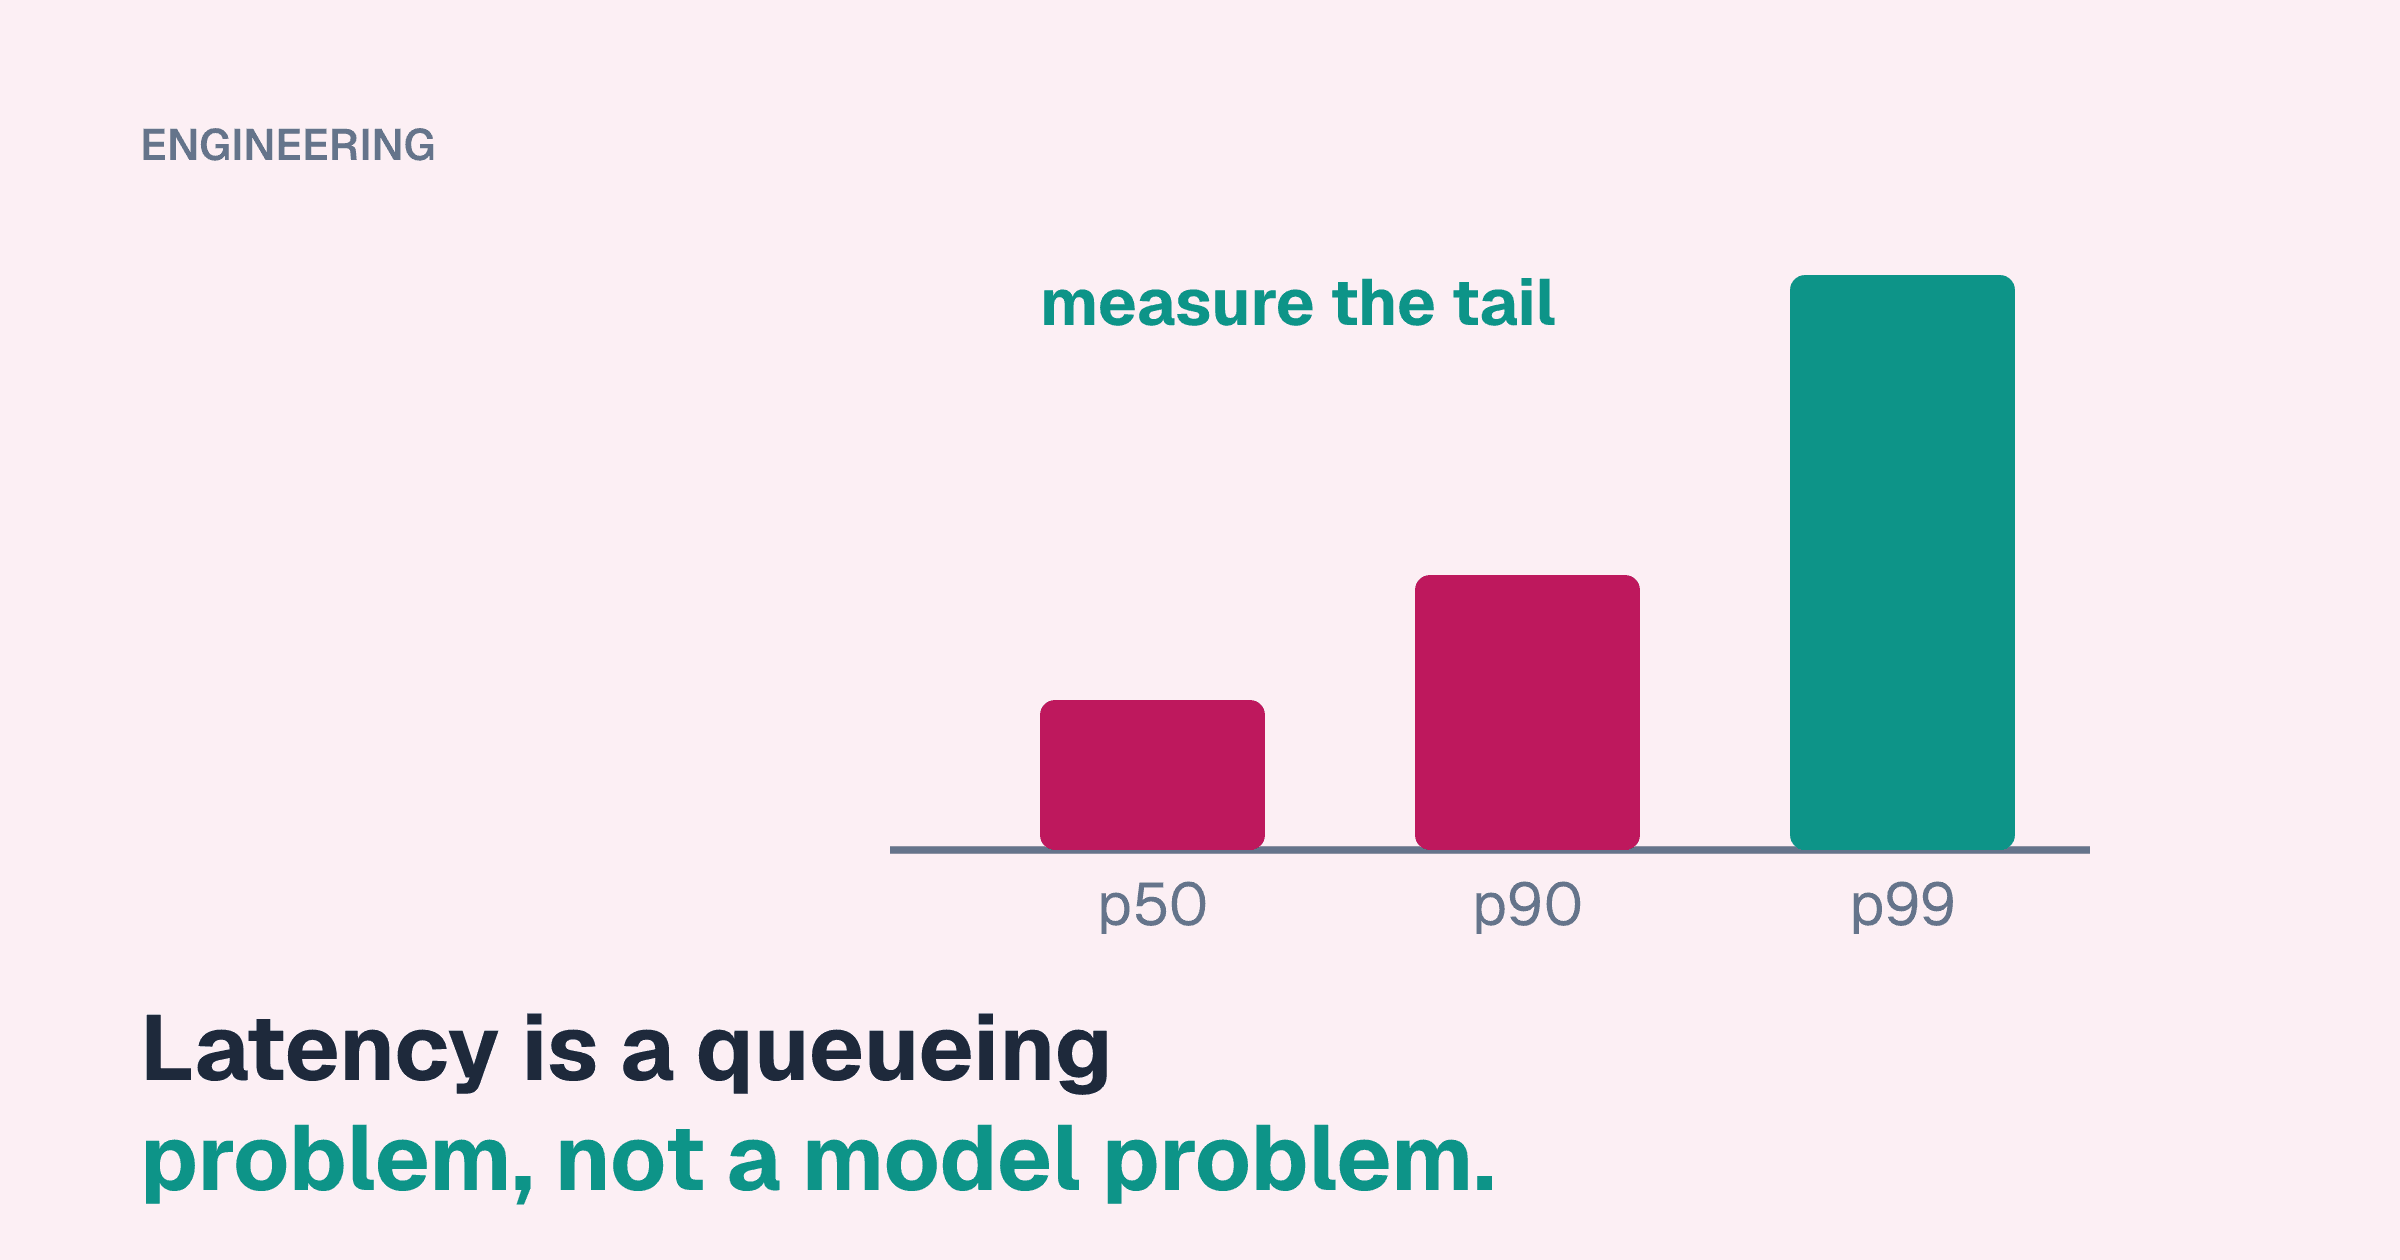
So when someone asks how to reduce LLM latency in production, my answer starts somewhere they do not expect. Before touching the model, the quantization, or the GPU: measure the right thing, at the right place, under honest load, and look at the tail. Most teams that believe they have a slow model actually have a queueing problem they cannot see, because their measurements hide it.
Here are the lessons that carried over, and what to do with each.
1. The average is not a measurement of anything a user experiences
In trading, nobody who has been burned once reports mean latency. A system with an excellent average and a bad tail loses money at precisely the moments that matter, because the tail is correlated with load, and load is correlated with the market doing something interesting.
LLM serving has the same structure. Your slowest responses are not randomly distributed. They cluster when traffic peaks, when someone submits a very long prompt, when the KV cache fills. Those are the moments users remember.
There is also an arithmetic reason the tail dominates. If a user session involves 20 requests, the chance that at least one of them lands in the slowest 1% is about 18%. For an agent workflow that chains 50 model calls, it is about 40%. Your p99 is not a rare event. It is what a large share of your users experience at least once per session.
What to do: record latency as a histogram, never as a running mean. Report p50, p95, p99, and the maximum. Do not average percentiles across servers or time windows; merge the histograms and recompute. Put the p99 on the dashboard that people actually look at.
2. One number is not enough: three clocks, three budgets
A trading system has a latency budget per hop: network in, decode, risk checks, order logic, network out. When the total is over budget you know which hop to open up.
An LLM request has three clocks, and they have different causes and different fixes.
- Time to first token (TTFT): queue wait plus prefill. Prefill processes the entire prompt and is compute-bound, so TTFT grows with prompt length and with how many other requests are ahead of yours.
- Inter-token latency (ITL), also called time per output token: the pace of streaming once it starts. Decode is memory-bandwidth-bound and is affected by batch size and by whatever else the scheduler runs in the same step.
- End-to-end latency: roughly TTFT plus output tokens times ITL. For long outputs it is dominated by output length, which is a prompt-design lever, not an infrastructure one.
A chat interface cares most about TTFT, and is comfortable once ITL is faster than reading speed. A voice agent has a hard TTFT budget. A batch extraction job cares about none of these, only throughput. Decide which clock matters for your product and set a budget for each, including the hops outside the model: gateway, retrieval, reranking, guardrails, network. It is entirely possible to tune an inference server for weeks while most of the latency sits in a retrieval step nobody has timed.
3. Your load test is probably lying to you
This is the lesson I would most like every team to absorb, because it is subtle and nearly universal.
Most load-testing setups are closed-loop: N simulated clients, each sending a request, waiting for the response, then sending the next. When the server slows down, the clients slow down with it. The server is, in effect, controlling its own test. During a stall, the requests that would have arrived from real users are never sent, so their terrible latencies are never recorded. The performance community calls this coordinated omission, and it can understate tail latency by orders of magnitude.
Real users do not coordinate with your server. They arrive when they arrive.
What to do:
- Use an open-loop load generator: requests are sent on a schedule (a fixed rate, or better, Poisson arrivals at a target rate) regardless of whether earlier requests have finished.
- Measure latency from the intended send time, not from when the client got around to sending.
- Sweep the arrival rate upward and plot p50 and p99 against it. You are looking for the knee, the rate at which the tail departs from the median. Your usable capacity is comfortably below that knee, not at it.
- Use realistic prompt and output length distributions, sampled from production logs if you have them. A test with uniform 500-token prompts tells you nothing about a workload where 5% of prompts are 30,000 tokens.
- Include any shared prefix (system prompt, few-shot examples) that production has, or prefix caching will flatter or fail to show up in your results.
vLLM's bundled serving benchmark supports a request-rate mode with randomized arrivals, which is the right shape. Whatever tool you use, check whether it is open-loop before trusting its percentiles.
4. Measure at the client, not at the server
Server-side timers start when the server begins working on a request. They do not see the time the request spent in a gateway queue, in a connection pool, in a TLS handshake, or in the inference engine's own waiting queue if the timer sits in the wrong place. In trading we timestamped at the wire for exactly this reason: the only latency that counts is the one the counterparty observes.
What to do: instrument TTFT and end-to-end time in the calling application, as the user would experience it. Keep the server-side metrics too. The difference between the two is a measurement of everything you forgot to measure.
5. Latency is a queueing problem before it is a speed problem
The most useful piece of theory in performance engineering fits in one line: as utilization approaches 100%, waiting time grows without bound. In the simplest queueing model, time in queue scales with utilization divided by one minus utilization. At 50% utilization a request waits about one service time. At 90%, about nine. At 95%, about nineteen. Nothing about the server got slower. The queue did that.
This is why a GPU that "has headroom" on average still produces awful p99s: traffic is bursty, and during a burst utilization is effectively 100%.
It has a commercial consequence that finance learned long ago. You cannot have both maximum utilization and low tail latency. Trading firms run critical paths at low utilization on purpose. With GPUs the pressure runs the other way, because idle GPUs are expensive, so make the trade-off explicitly: decide the p99 target first, find the arrival rate that meets it, and accept the utilization that implies. For latency-insensitive work, run a separate pool hot.
6. Head-of-line blocking: the long prefill problem
In a matching engine or a market data handler, one slow message at the head of a queue delays everything behind it. The LLM equivalent is a long prompt. Prefill for a 30,000-token document is a large block of compute. If the scheduler runs it in one piece, every other user's token stream pauses until it completes. They see it as a stutter in the middle of a response: a spike in ITL that no average will show.
The fix is the same idea as in any fair scheduler: break the big job into pieces and interleave. In vLLM this is chunked prefill. Long prefills are split into chunks bounded by a token budget per scheduler step, and pending decodes are batched first. In current vLLM versions it is enabled by default. The knob that matters is --max-num-batched-tokens: a smaller budget protects inter-token latency for users who are already streaming; a larger one improves TTFT and throughput. There is no universally right value, which is the point. It is a dial between two of your three clocks, and you set it according to which one your product cares about.
If your workload mixes interactive chat with heavy document processing, consider the blunter instrument too: separate deployments, so that the two classes of traffic never share a queue. Trading systems segregate flows by latency class for the same reason.
7. Warm-up, pauses, and the first request of the day
Anyone who has run a Java trading system knows not to trust the first several thousand orders: the JIT compiler has not finished, caches are cold, and a garbage collection pause is waiting to land at the worst moment. We wrote warm-up routines, and we engineered allocation out of the hot path.
Inference servers have direct counterparts.
- Cold start. Loading tens of gigabytes of weights, compiling kernels, and capturing CUDA graphs can take minutes. Autoscaling from zero makes that a user's TTFT. Keep a warm minimum, and send synthetic warm-up requests before a replica joins the load balancer.
- Preemption. When the KV cache fills, the engine evicts a running request and later recomputes it. To that user it looks exactly like a GC pause: a response that freezes mid-sentence. vLLM's documentation lists the remedies: raise
--gpu-memory-utilization, lower--max-num-seqsor--max-num-batched-tokens, or add GPUs through tensor parallelism. Watch the preemption counter. A nonzero steady rate means you are admitting more work than you have memory for. - Cache coldness. Prefix caching makes repeat system prompts nearly free, until a restart or an eviction empties the cache and TTFT jumps. Know what your TTFT is with a cold cache, because that is what you will see during an incident.
8. Bounded queues, admission control, and shedding load
An unbounded queue is a promise to serve every request eventually, at a latency nobody wants. A request that has waited 40 seconds for a chat response is worthless; the user has left, and serving it now steals capacity from someone who is still there. Exchange gateways throttle and reject for exactly this reason. A fast "no" is a feature.
What to do:
- Cap concurrency in the engine (
--max-num-seqs) at a level where your latency targets hold, and cap the waiting queue at the gateway in front of it. - When the queue is full, return HTTP 429 or 503 quickly with a retry hint, and let the client back off or fall back.
- Set deadlines. If a request has not started within its TTFT budget, drop it, and cancel generation when the client disconnects so abandoned streams do not hold KV cache.
- Give interactive traffic priority over batch traffic, or a separate pool.
- Cap
max_tokens. Output length is the biggest single factor in end-to-end latency, and an unbounded generation is an unbounded hold on a batch slot.
The knobs, once you can see
Only after the measurement is honest is it worth turning dials. The ones that matter most in vLLM, and their equivalents elsewhere:
| Knob | Trade-off |
|---|---|
--max-num-seqs | Concurrent sequences per step. Higher raises throughput and KV pressure; lower protects per-request latency and reduces preemption. |
--max-num-batched-tokens | Token budget per step. Lower favors inter-token latency; higher favors TTFT and throughput. |
--enable-prefix-caching | Reuses computation for shared prefixes. Large TTFT win when prompts share a system prompt or documents; on by default in recent versions. |
--gpu-memory-utilization | More KV cache space, fewer preemptions, less headroom for anything else on the GPU. |
--speculative-config | Speculative decoding: a draft mechanism proposes tokens that the main model verifies. Helps inter-token latency at low load; the benefit shrinks as batches fill, so test at production concurrency. |
--tensor-parallel-size | Splits the model across GPUs. Lowers per-token latency for large models and adds KV space, at the cost of interconnect overhead. |
Beyond the engine: shorter prompts cut TTFT, shorter outputs cut end-to-end time, and a smaller or sparser model that passes your evals cuts everything. Always stream; perceived latency is TTFT, not completion time.
Change one thing at a time, rerun the same open-loop test, and compare histograms. That habit, more than any individual flag, is what low-latency engineering actually consists of.
A checklist to take away
- TTFT, inter-token latency, and end-to-end time are recorded separately, as histograms, at the client.
- Dashboards show p50, p95, p99; nobody quotes the mean.
- Load tests are open-loop, with production-like prompt and output lengths, swept to find the knee.
- Each hop in the request path has a latency budget, and the budgets add up to the product requirement.
- Preemptions, queue depth, and KV-cache utilization are monitored and alerted on.
- Queues are bounded; overload produces fast rejections rather than slow successes.
- Replicas are warmed before taking traffic; cold-cache TTFT is known.
- Interactive and batch traffic do not share a queue.
None of this is specific to language models, which is rather the point. The model is new. Queues, tails, and dishonest benchmarks are very old, and the systems that handle them well are built by teams that decided to look. If quality measurement is your next gap after latency, these three measurements are where I would start.